Government has thrown open its public procurement dashboard to public view. You have to say, this is an excellent idea. Although, presumably in a desperate attempt to root out some of the more gratuitous corruption that is endemic to the process. Former US Supreme Court judge Louis Brandeis is famous for saying, “Publicity is justly commended as a remedy for social and industrial diseases. Sunlight is said to be the best of disinfectants; electric light the most efficient policeman.”
So, you know, kudos to them for doing it. What we have been given access to is a essentially a data dashboard, which anyone can see. Amazing. The dashboard, drawn from the Basic Accounting System (BAS) on government tenders, is available here. And something called the Central Suppliers Database (CSD), a kind of analysis system, here.
The databases provide a vast amount of information. Getting to grips with it is going to take a while, but here are some preliminary “quick takes”. The launch of the new procurement payments dashboard coincided with the Medium-Term Budget Policy Statement (MTBPS) and was mentioned by Finance Minister Enoch Godongwana last Wednesday. The idea is to allow members of the public to scrutinise the government’s procurement data, but there are some exceptions relating to policing, defence, and intelligence. Importantly, the BAS system apparently excludes municipal and state owned enterprise (SOE) tenders.
In the midst of all the totally justified congratulations, there are problems. In the BAS system, there really is a trove of information, before we even get into the dubious tender stuff. First, take a look at this:
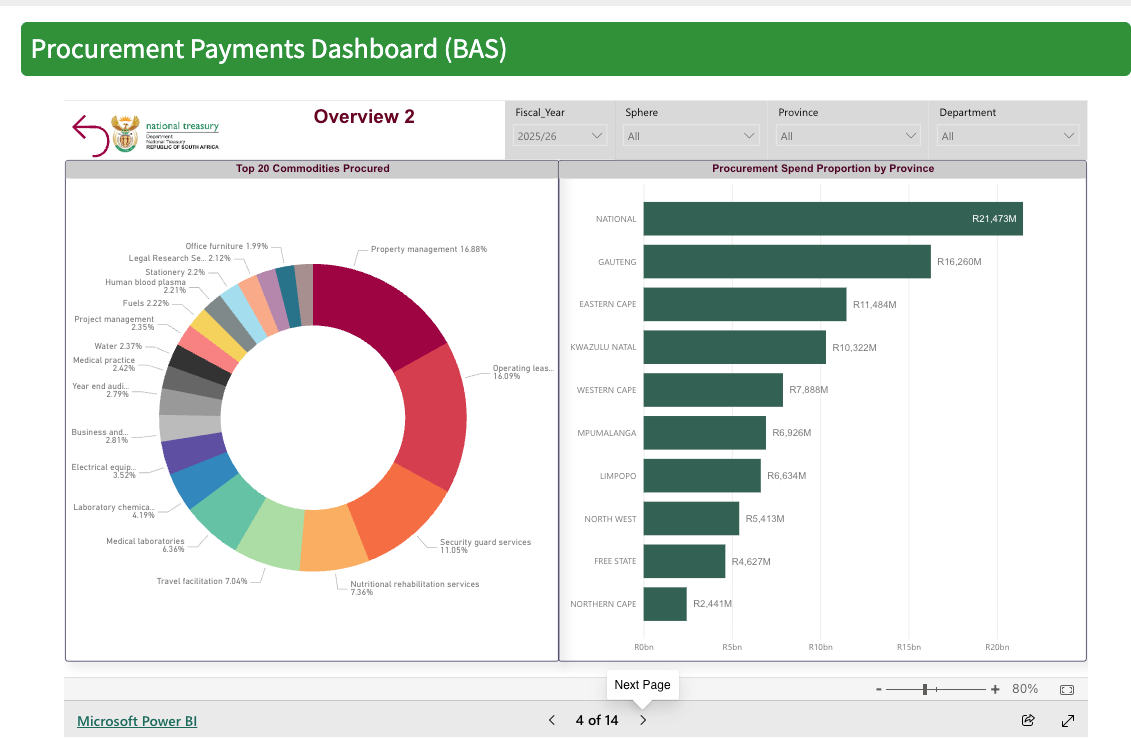
This is the breakdown of spend by function, or what the Treasury here calls “commodities”. Is it just me, or is it odd that property management is the biggest single spend? To be clear, that is not money paid for leases because “operating leases” is the second-biggest item. Since spending so far has been R91-billion, that means R15-billion has been spent on property management—a billion more than paid on actual leases. Wow. I never knew that property management was such a good business.
To me, er, that would be a big red flag, right there.
OK, next page.
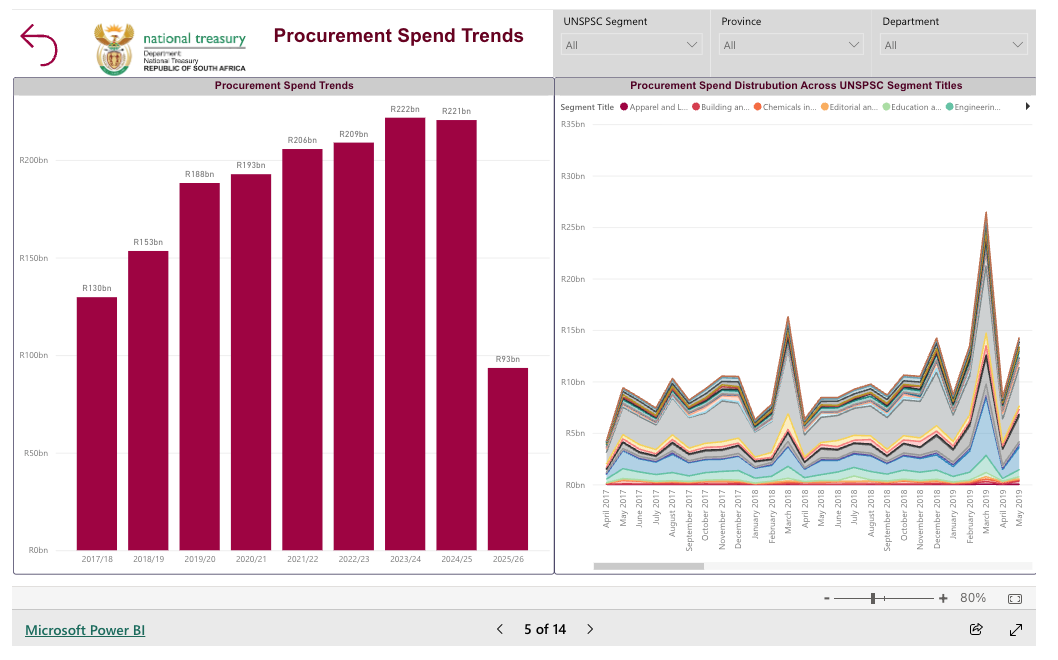
This shows the total year-by-year breakdown and the month-by-month breakdown. The year-by-year illustrates something we know and love about our government: they are just useless at keeping spending under control. This isn’t total government expenditure, but money paid to tenderpreneurs went from R130-billion in 2018 to R222-billion in 2024. That’s a 10% increase every year.
Did nobody notice these increases were, like, double that of inflation?
Obviously, the tenderpreneurs are learning and gaming the system and, to put it frankly, just milking it. It’s good to see the year-on-year increases stopped last year, and this year it may even show a decline. But still, this is a frightening amount of money. How is it possible, in the context of the national newsflow, that government seemed oblivious that something was amiss? Its incredible.
The graph on the opposite page above depicts a huge spike in March. What’s that about? Well, that’s obvious: departments rush to get their spending done before year-end because money not spent, in the minds of bureaucrats, is not money saved; it's money lost.
This doesn't just indicate poor planning—although it is that, of course—it’s an insight into why governments are generally so bad at making spending decisions. Milton Friedman’s famous matrix applies here: businesses spend their own money on themselves, so there is a strong incentive to minimise cost and maximise value. Bureaucrats spend other people’s money on other people, so there is a weak incentive on both fronts. In business, efficiency is an input. In bureaucracies, compliance is the input.
There is so much more to be said, but let’s move on.
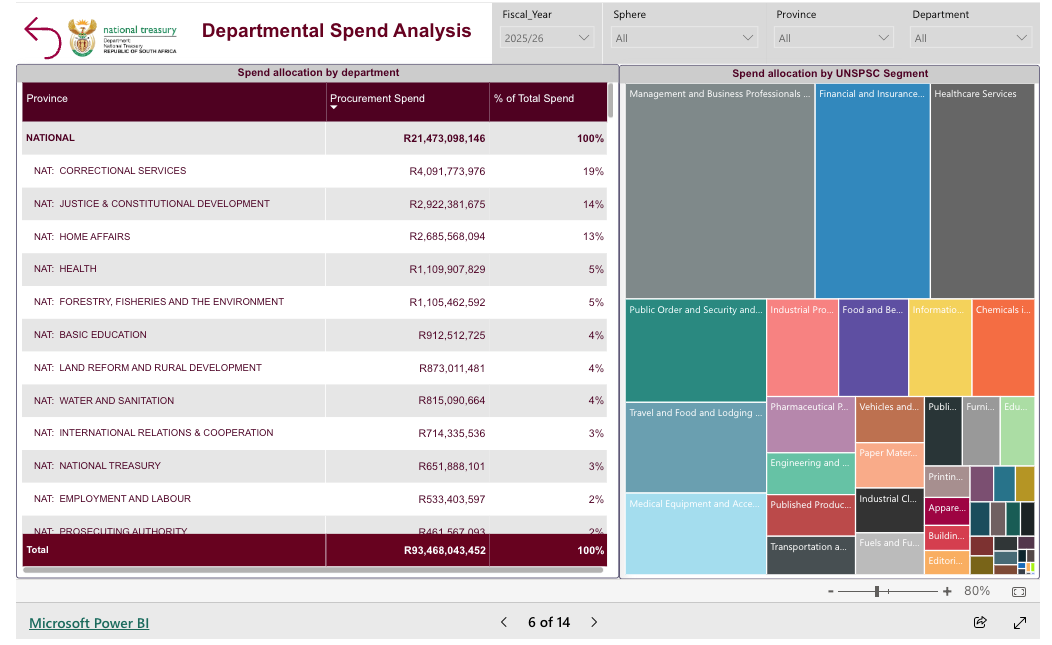
This is the departmental breakdown and the expenditure by type. You might expect that the biggest spenders will be health and education, right? Not even close. The biggest target of tenderpreneurs is…correctional services. Why? And then the justice department! Why? That strikes me as nuts, and we need to know why.
The biggest segments winning tenders also seem odd to me: management and business professionals on the one hand, and financial and insurance services on the other. I presume that management and business professionals would include accounting services, which makes sense. But why are government departments outsourcing their banking at such a huge rate? There may be a good reason for this, but it seems very high to me.
The dashboard shows a raft of graphs showing the racial, gender, and youth breakdown, which together constitute about 40% of the total spend. This is our political moment, so, understandably, they have to do this kind of breakdown. The only point I would make is that there are over 26,000 black-owned suppliers, which shows you what a large political constituency this group has become.
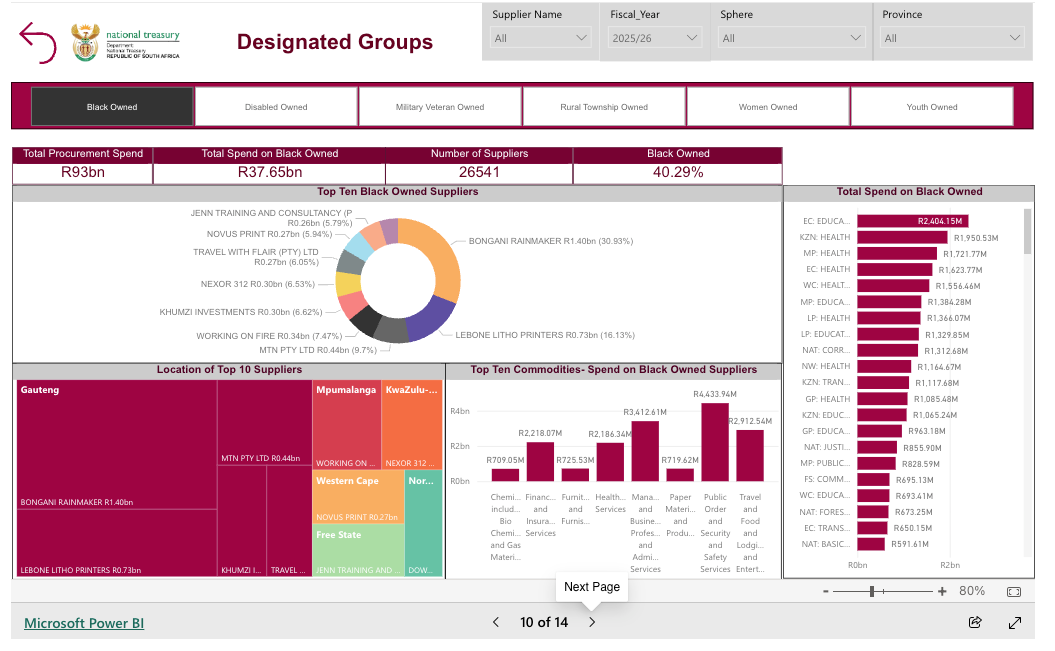
The last page, as always, is the most interesting, and this is the spend per supplier. The dashboard allows you to filter the list from largest to smallest, and below is what you get…
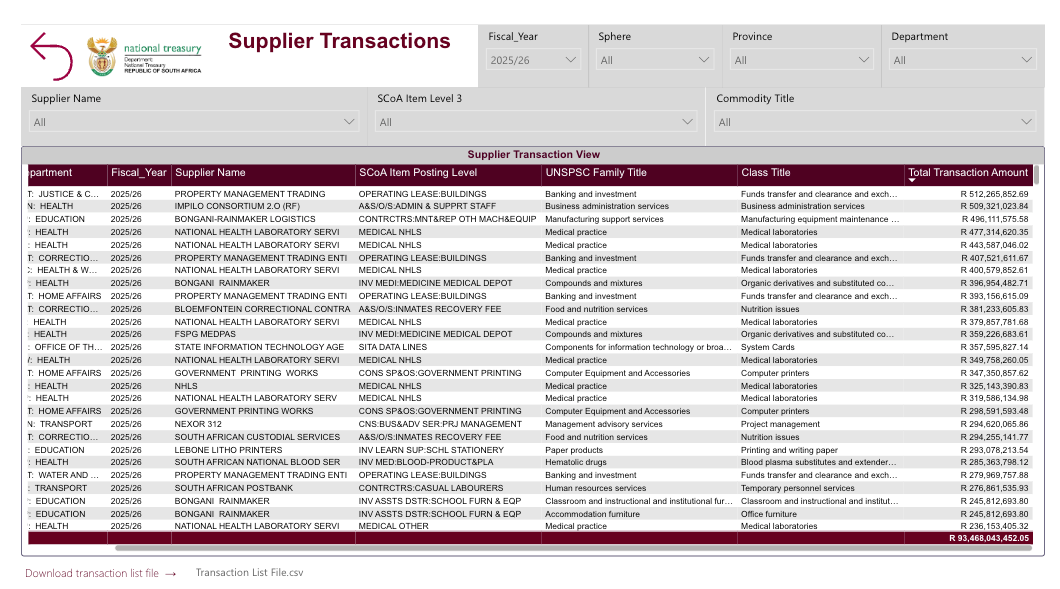
A company with the sexy name of Property Management Trading has nailed the biggest single contract so far this year —an eye-watering R512-million—awarded by the National Justice Department for leasing buildings. That is so far this year.
Just for fun, let's imagine how many office blocks you could build for R1-billion a year. Recent estimates put office-building construction at about R15,000–R20,000 per m² for standard-to-good quality commercial space. At this rate, you could probably build a 25-storey office block every year for what the Justice Department is paying just to Property Management Trading. I am not making this usp. See point above about how governments spend.
Oddly, this dashboard doesn’t provide information about one thing you would really think would be totally obvious data dump —maybe it does, but it’s not visible on this system. And that is the total individual supplier breakdown. As it stands, the dashboard does tabulate the contracts won by an individual supplier, but it does not accumulate individual contracts.
However, happily, it does allow you to download the entire file, so let's do that for them. After five minutes of work, this is what you get: these are the top ten tenderpreneurs so far this year. Congratulations, and happy Lambo driving.
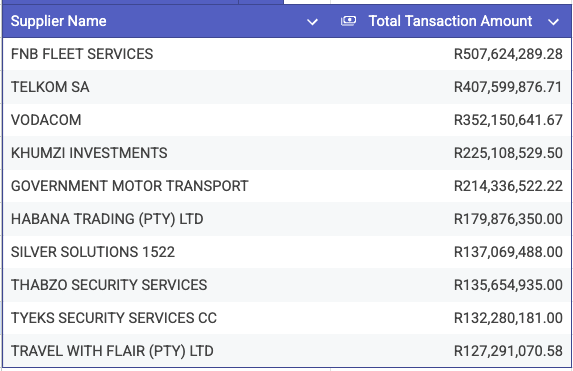
Two things are noticeable here. First, the amount spent on telecoms is just astounding. There must still be some landline costs involved, but let's assume both the Telkom and the Vodacom payments are for cellphone bills for civil servants. There are currently 1.3 million civil servants, so that would mean the government is paying about R100 a month toward every civil servant’s cellphone bill. But not all government employees get a cellphone allowance, so who does? And who does not?
More pointedly, who or what is Khumzi Investments, and why is the government (mainly the Eastern Cape Government—obvs) paying the company half a billion rand a year, and for what? The company has no website, no digital footprint, and is owned by a single person. It's a travel company of some sort, but still: red flags, people. Red flags.
Keep tuned. 💥

Join the conversation